
Badgers Analytics: Noah Reynolds Breakdown
Transfer Guard Noah Reynolds—Player Metrics, Play-Type Profile, Shot-Type Profile:

TOPICS:
Player Metric Trends 2022-2023
Points/Shot
Points Created/USG%
Ball Security Factor
USG%
Shot Profile
Reynolds vs. UW Guards
3P Shooting
Player Metrics - Season Trend:
Points/Shot:
Points/Shot Formula = Points / FGAs + (0.5*FTA)

Season Average = 1.10 Points/Shot
In the 18 Games this Season, Noah Reynolds only had 2 in which he did not achieve 0.80 points/Shot. Reynolds also had an insane 8 games in which he broke the 1.20 Points/Shot barrier!!! That’s some hot shooting!
It looks as though his #’s slowed down a bit but I’ll dig into why that is a bit later.
Points Created/USG%:
Points-Created/USG% Formula = (Per40 Points + Per40AST Value) / (USG% * 100)

Season Average = 0.94 Points-Created/USG%
These #’s are actually quite impressive when you have the full context.
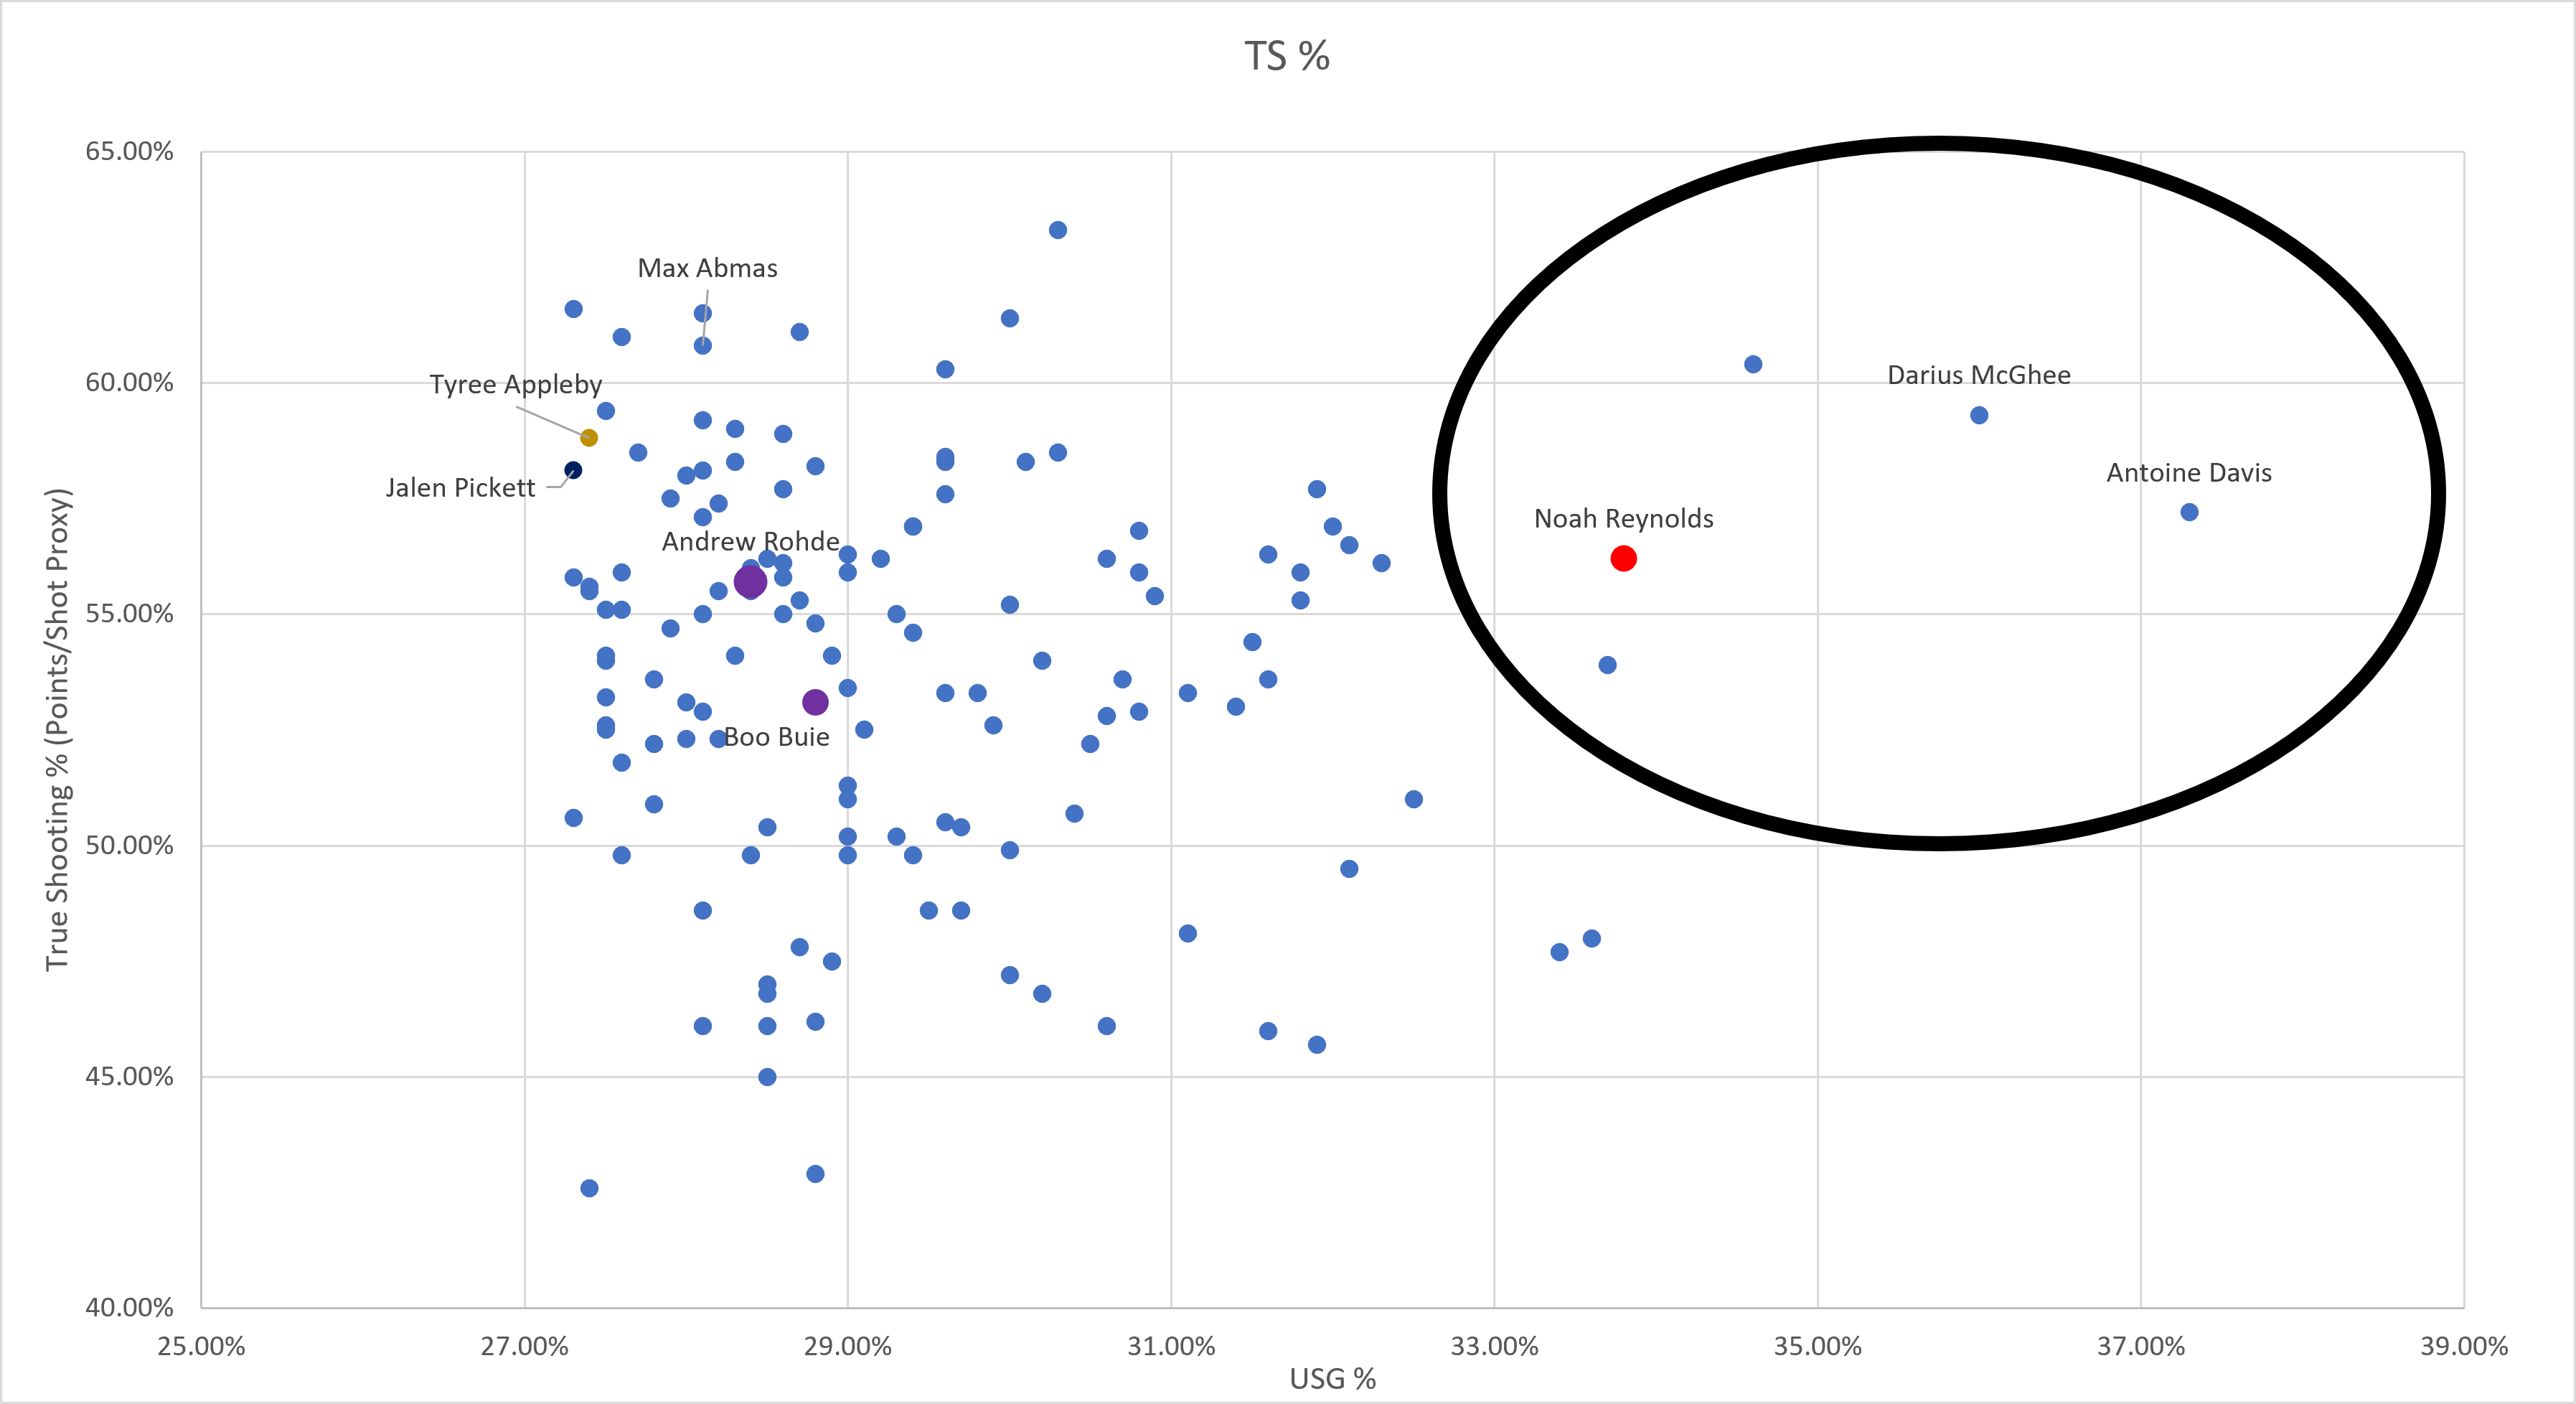
Reynolds is in the conversation with McGhee (Liberty Stud) and Antonie Davis (2nd All-Time Leading Scorer in NCAA History in terms of Bucket getting ability!!!
Removing those Outliers:

It’s very hard to increase your USG Rate to 31%+ and still maintain that level of shooting efficiency!!!!

Ball Security Factor:
Ball Security Factor Formula = DREB% + ( AST RATE - TO RATE) + STL%

Average Ball-Security Factor = 14%
Again it’s difficult to maintain high levels of ball Security, but for the most part, Reynolds is usually in that 15-25% Ball Security range which is okay but not great. The biggest area of improvement is his TO Rate; I’d like to see that get down into the Teens while maintaining that AST Rate, and we’ll have arguably one of the best 6-Men in the Country! From an offensive standpoint.

USAGE %:
USAGE % Formula = % of Team’s FGAs, FTs, AST, TOs while on Court
Average USG % = 34%
That is just an insane amount of USG, 4th Highest in the Country Last Year!!!
Here’s what’s scary! His injury might have made him the biggest Portal Steal of the Year!!!
Here’s Why:
Game 12 of the Season (DEC. 31st) is when Reynold’s suffered his 2nd Head Injury in 6-Months according to reports from Ryan Thornburn! His Season-Ending injury came in the 18th game of the Season against San Jose St.


So what does it look like if we parse out his performance before his initial Head-Injury?
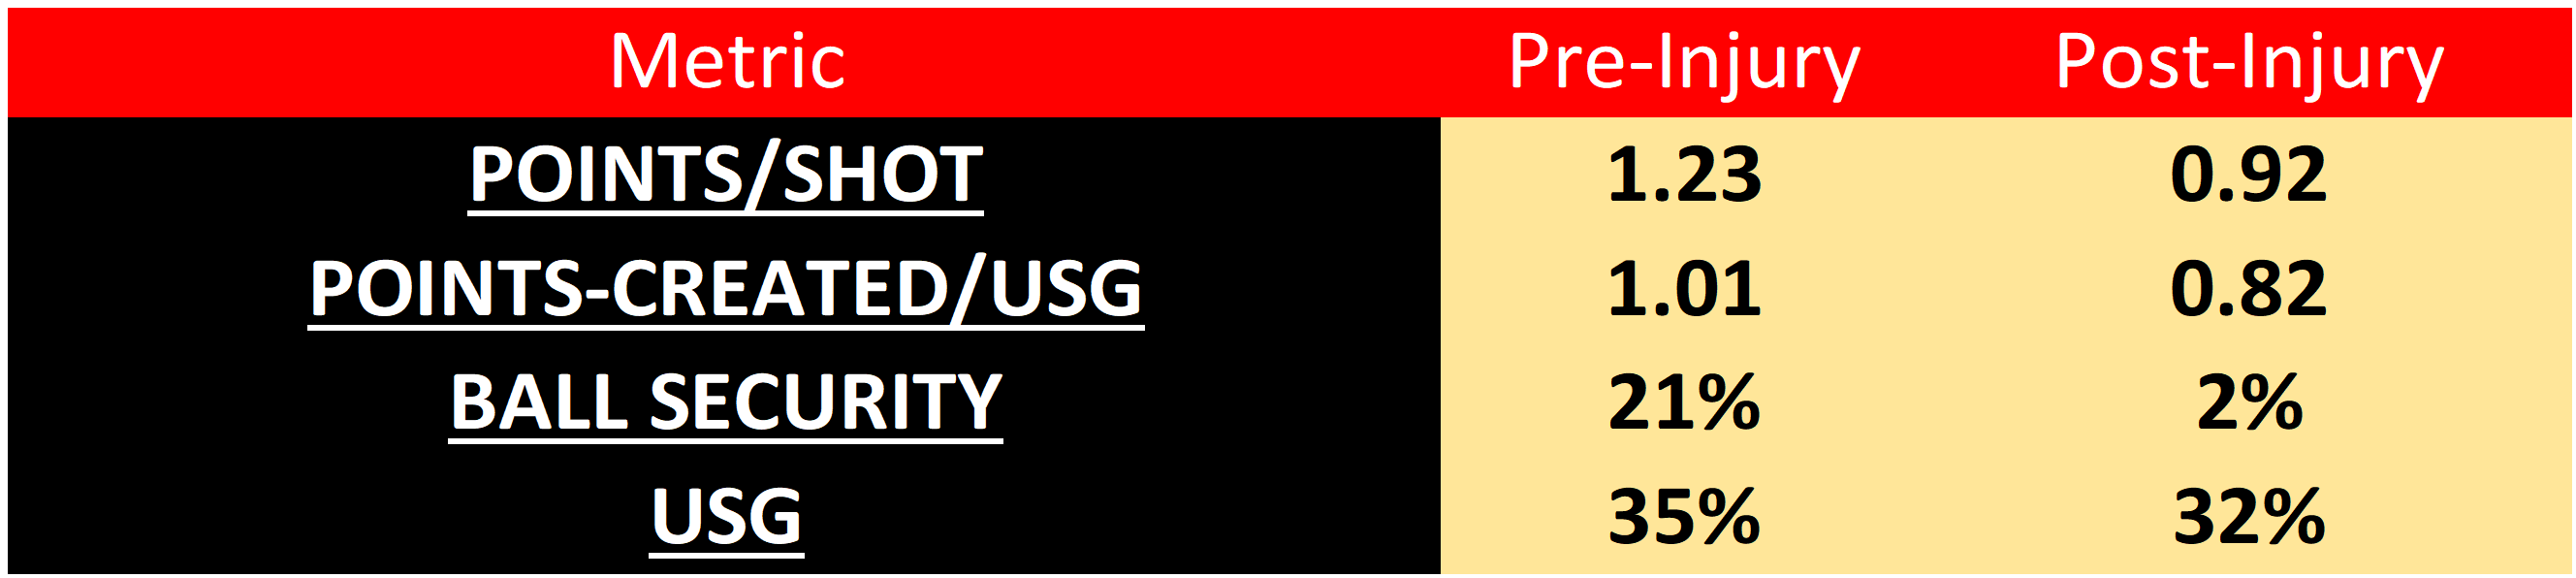
WOAH! Folks, I know where the pessimist’s heads are going (That’s the Mountain West!!). Do you mean the Mountain West that sent a team to the National Championship? Do you mean the Mountain West that had the 6th best Conference ADJ Efficiency Margin???
Oh, right, the guy was putting up INSANE Numbers in one hell of a league!!
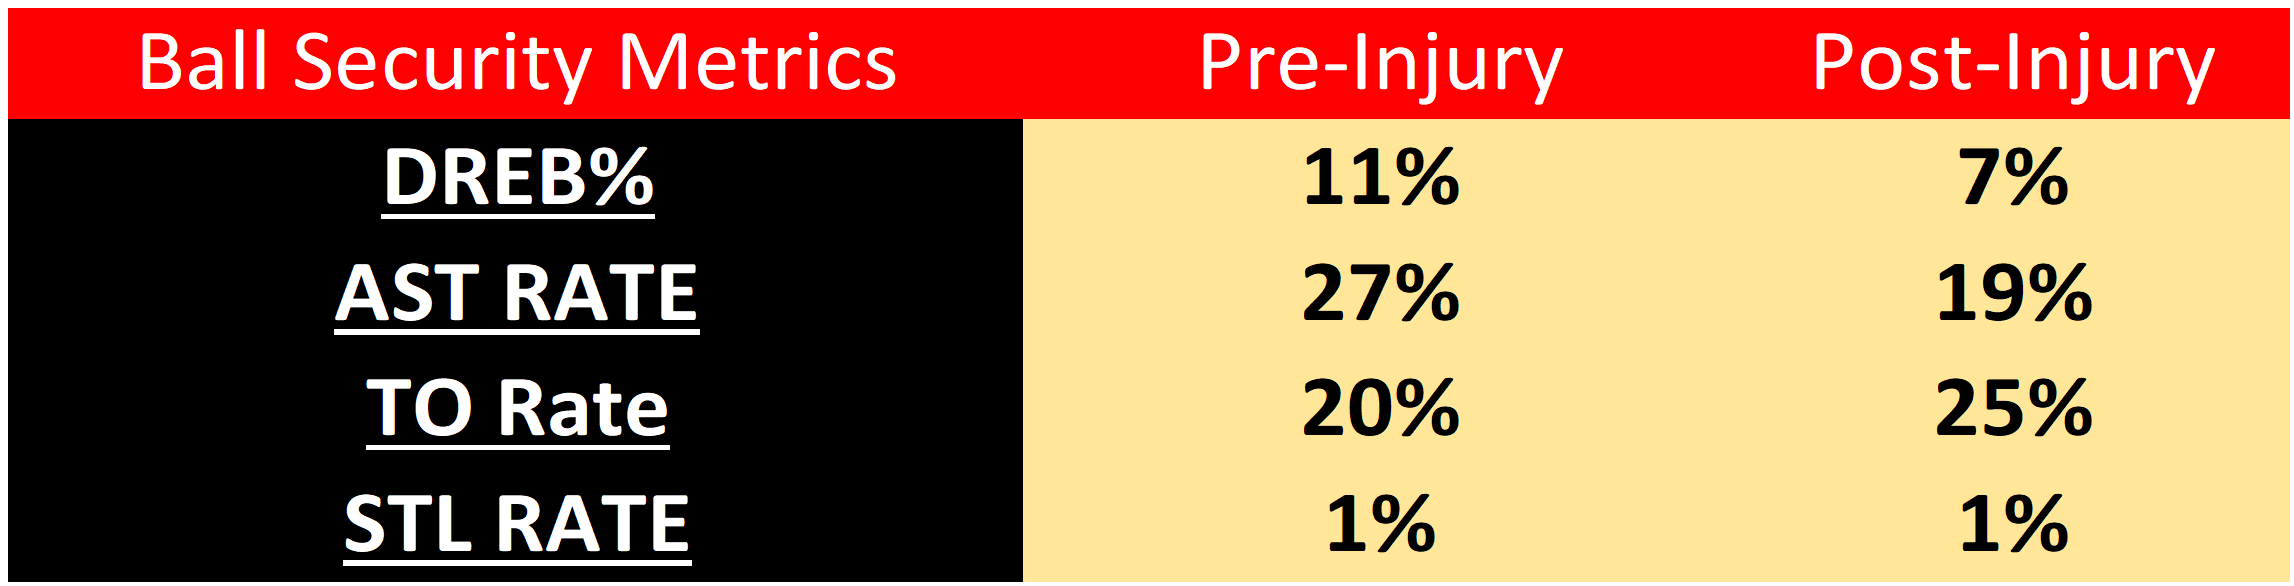
Look at the difference in AST/TO Rate Pre-Injury and Post!!!
Also, a fairly sizeable dip in DREB% you could attribute to Injury!
Shot Profile:

