
Badgers Analytics: 2022-2023 Player Analysis - Tyler Wahl
Breakdown of Tyler Wahl's 2022-2023 Season

TOPICS:
Player Metrics - Season Trend
Points/Shot
Points-Created/USG%
Ball Security Factor
USG%
Player Metrics
Pre-Injury vs. Post-Injury Wahl
Wins vs. Losses
Shot Profile
2021-2022 vs. 2022-2023
Points/Shot
2021-2022 vs. 2022-2023
Player Metrics - Season Trend:
Points/Shot:
Points/Shot Formula = Points / FGAs + (0.5*FTA)
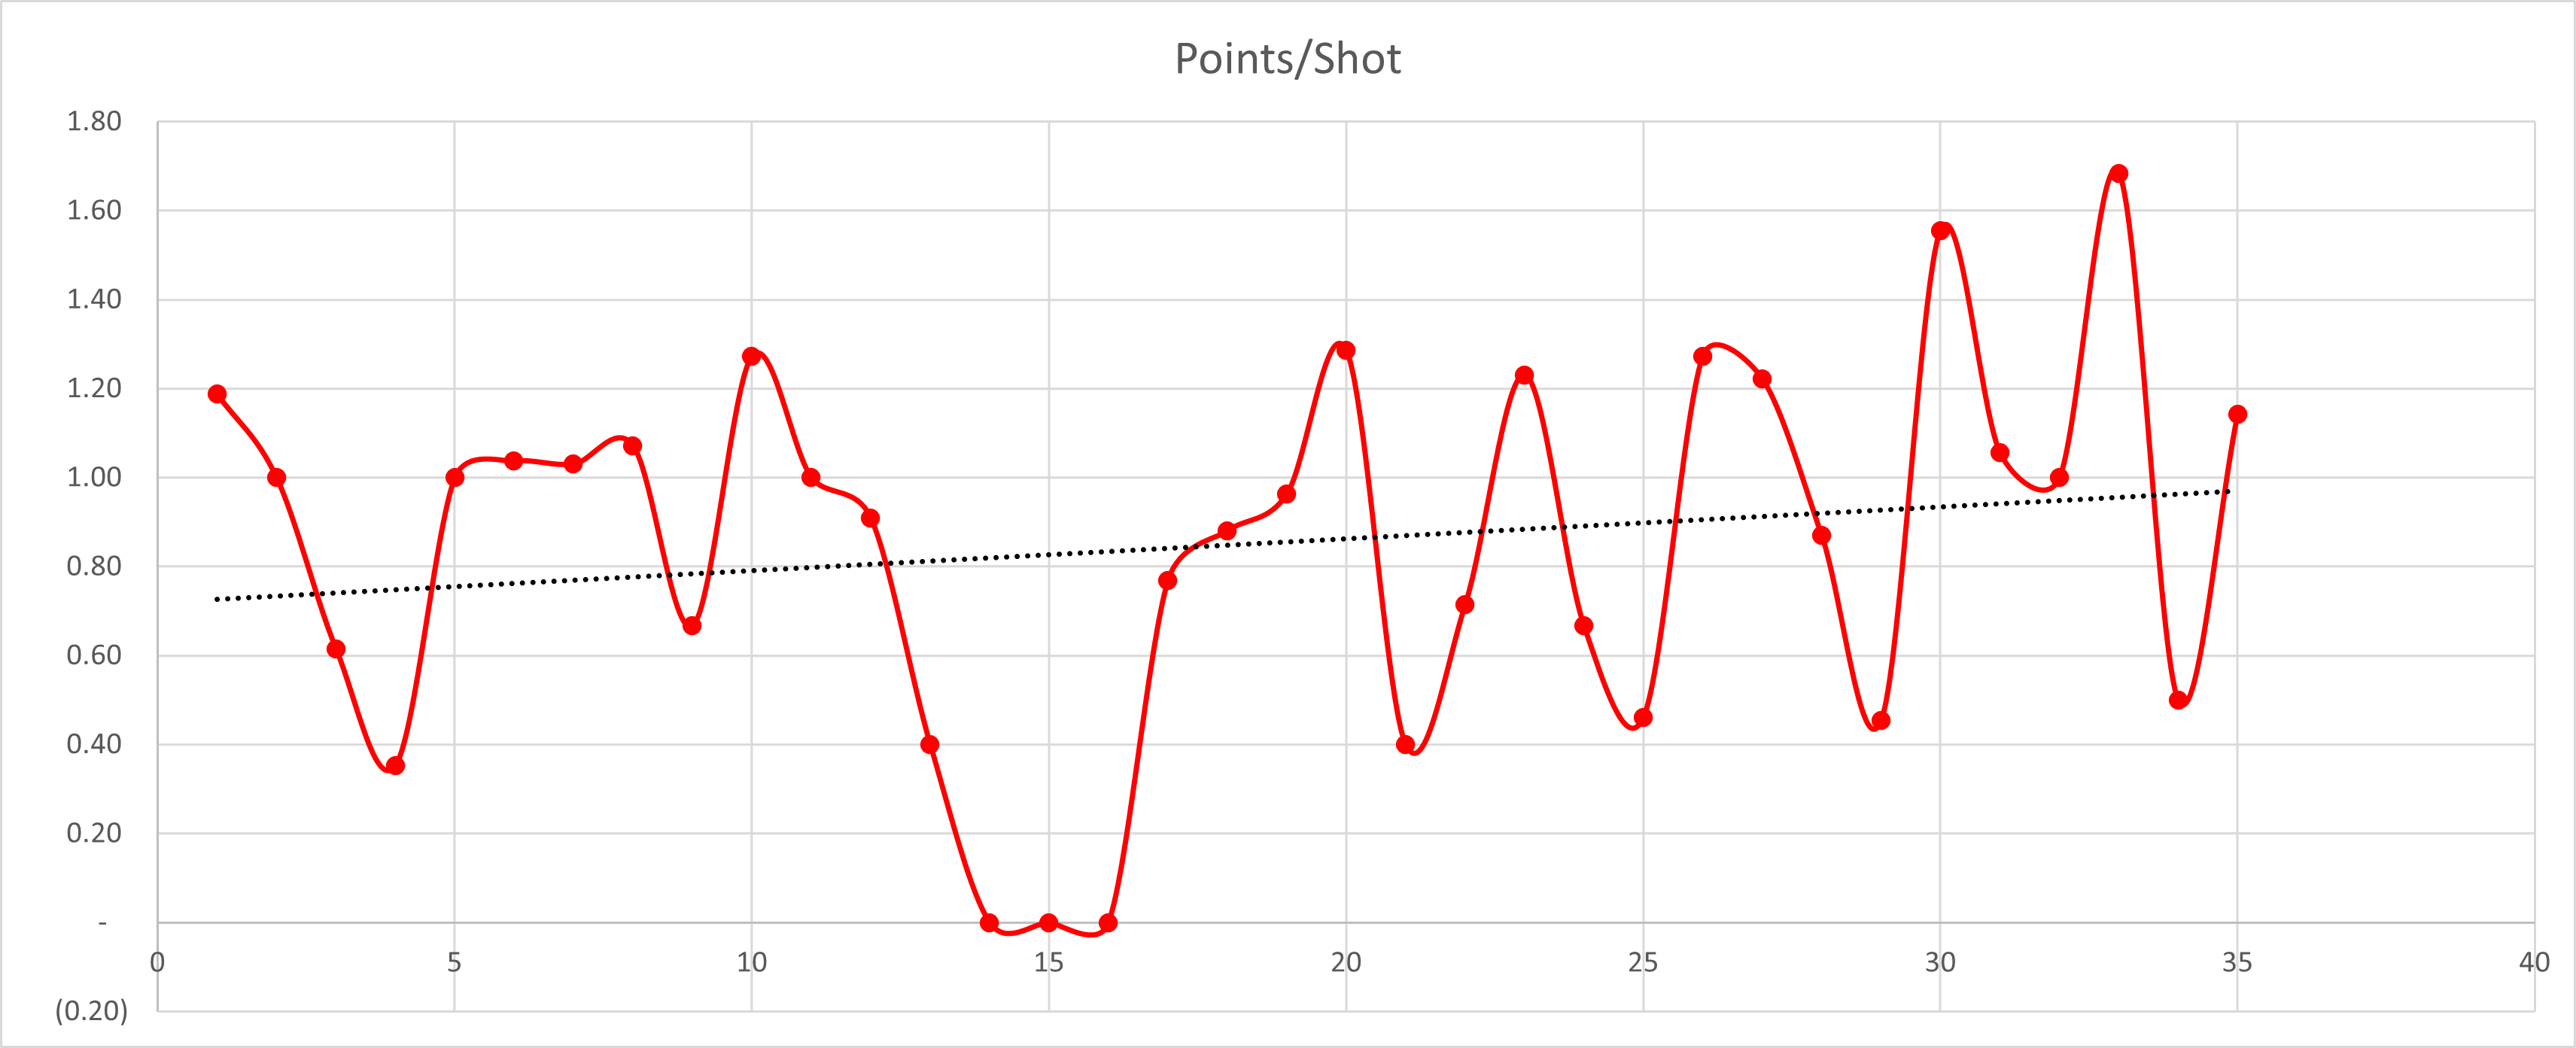
Season Average = 0.94 Points/Shot
We can see that for T. Wahl, this year was truly a wavy year. There was a severe lack of consistency in his scoring efficiency! He would turn in 17 performances with a Points/Shot > 1.00, which is pretty good! 1.20 would be ELITE which T. Wahl achieved 7 times this year.
Players who achieved ELITE status over the course of the 2022-2023 Season at >25% USG:
Adama Sanogo
Zach Edey
Azuolas Tubelis
Trace Jackson-Davis
The problem for Wahl was the really poor outings (Points/Shot < 0.8) in which he turned in 8 performances under that mark!! And when his FG + FTAs Per Game wass relatively flat at ~13/Game (Post-Injury), that’s an issue…for obvious reasons!

When a guy who is ~18% of your Point Scoring ATTs and his efficiency in those looks was drastically different from game to game, so will your offensive production! Consistency is the key for UW and for Tyler Wahl offensively next season.
Points Created/USG%:
Points-Created/USG% Formula = (Per40 Points + Per40AST Value) / (USG% * 100)

Season Average = 0.94 Points-Created/USG%
Ball Security Factor:
Ball Security Factor Formula = DREB% + ( AST RATE - TO RATE) + STL%

Average Ball-Security Factor = 24%
USAGE %:
USAGE % Formula = % of Team’s FGAs, FTs, AST, TOs while on Court
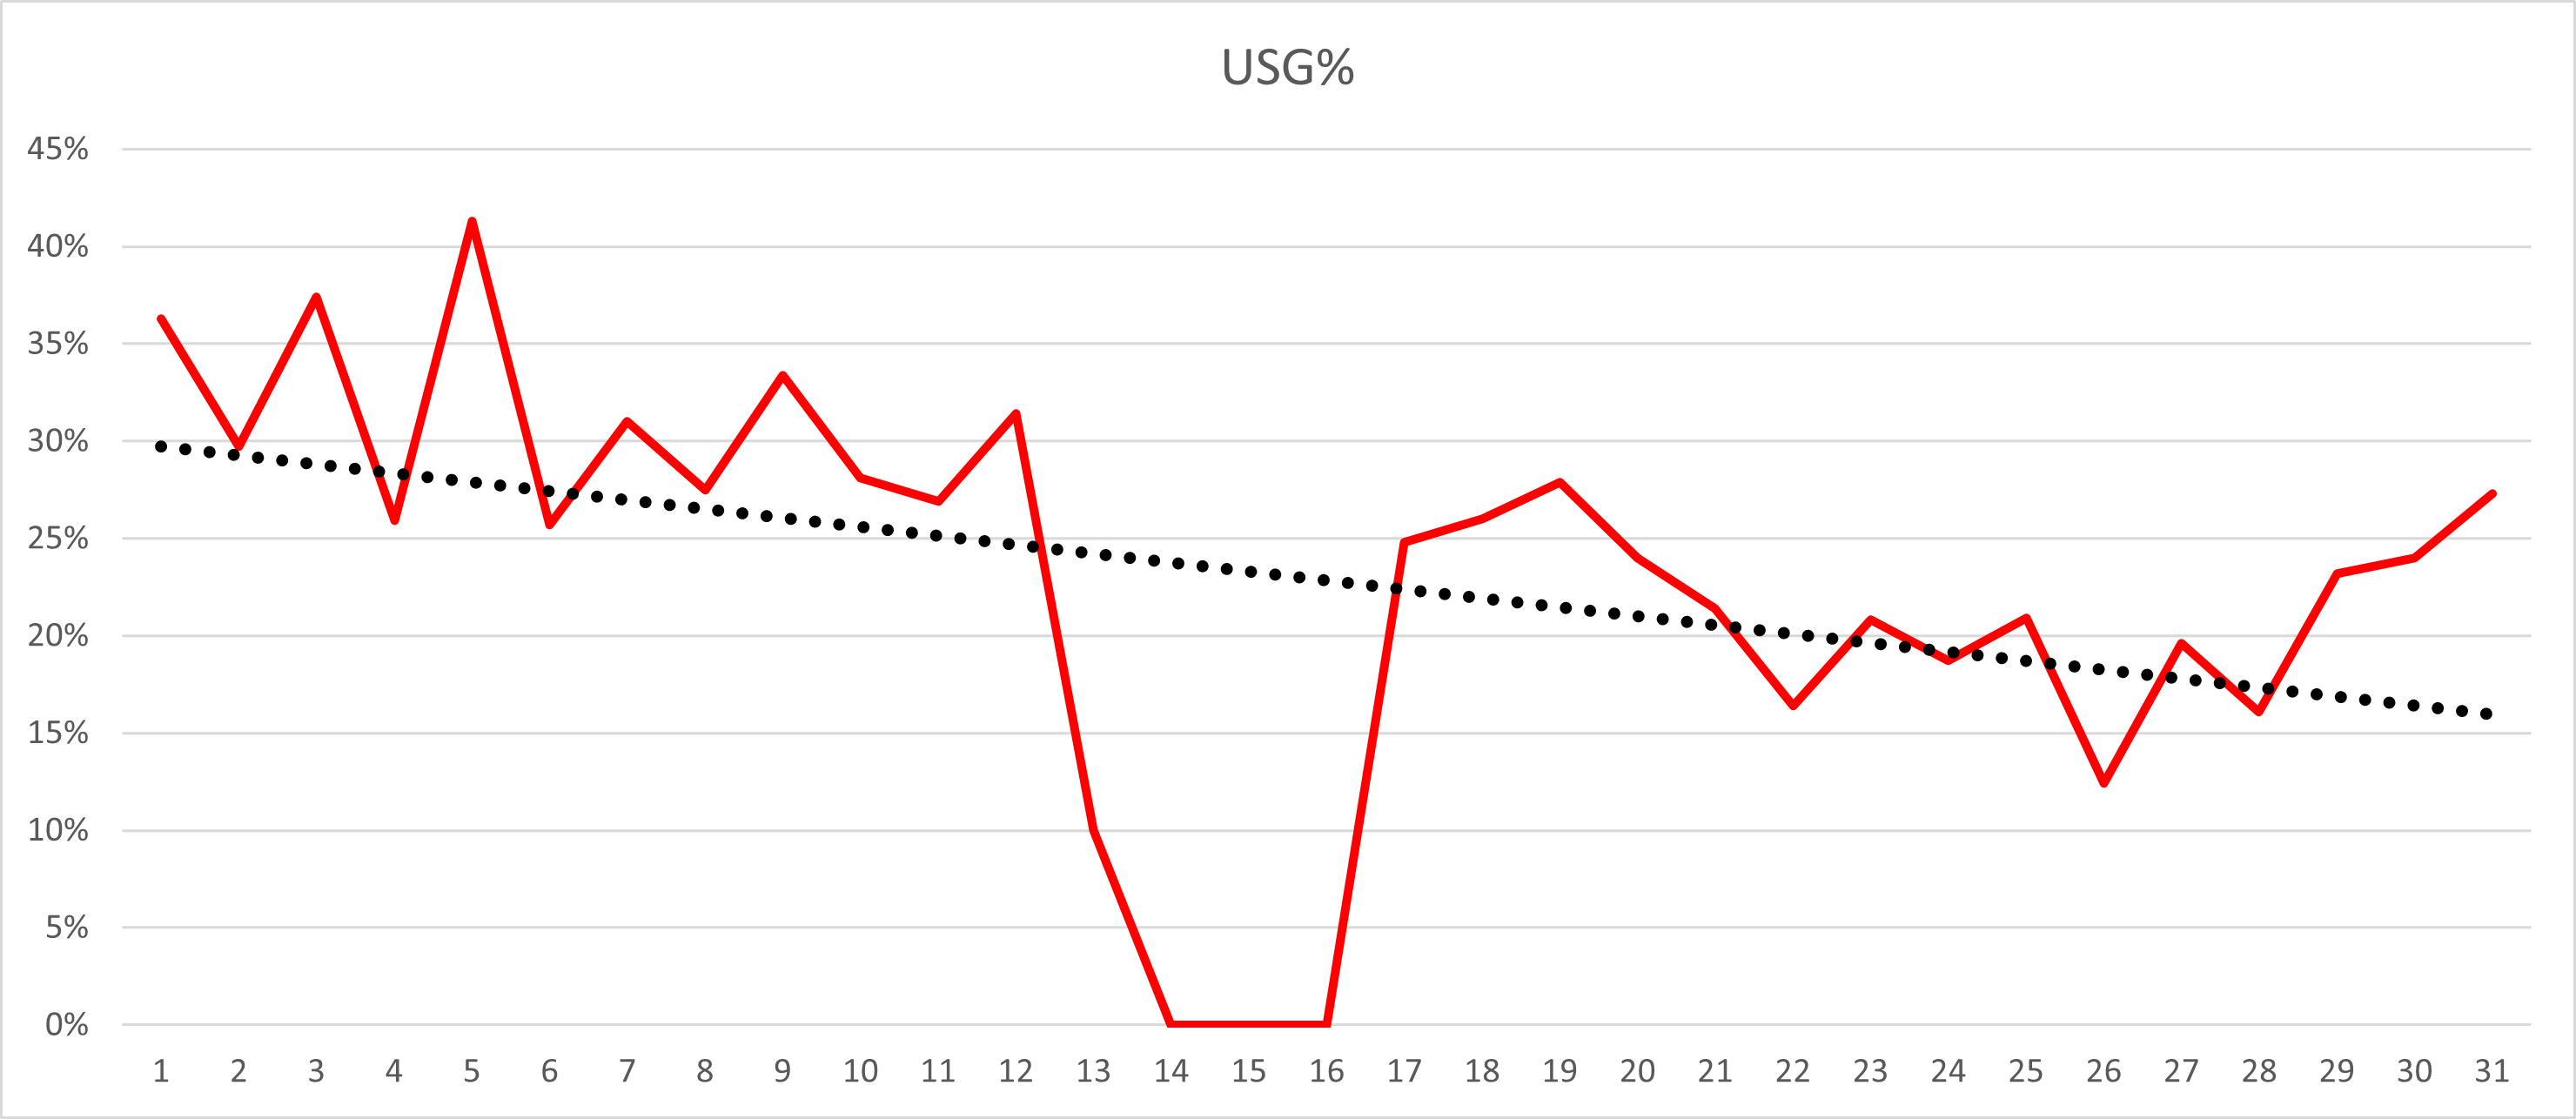
Average USG % = 25%
